Business Analysis & Visualization
Freelance Project
Description
This project analyzes the Superstore dataset to uncover insights across sales performance, shipping efficiency, regional trends and time-based growth.
Tools
Using Excel and Power BI, I built four dashboards to explore key business questions:
1) Which products and categories are most profitable?
2) How do discounts affect profit margins?
Which shipping modes and order priorities are cost-effective?
3)What are the seasonal and yearly trends in performance?
4)How do sales and profit vary by region and market?
These dashboards are designed to support strategic decisions, highlight inefficiencies, and drive performance improvements.
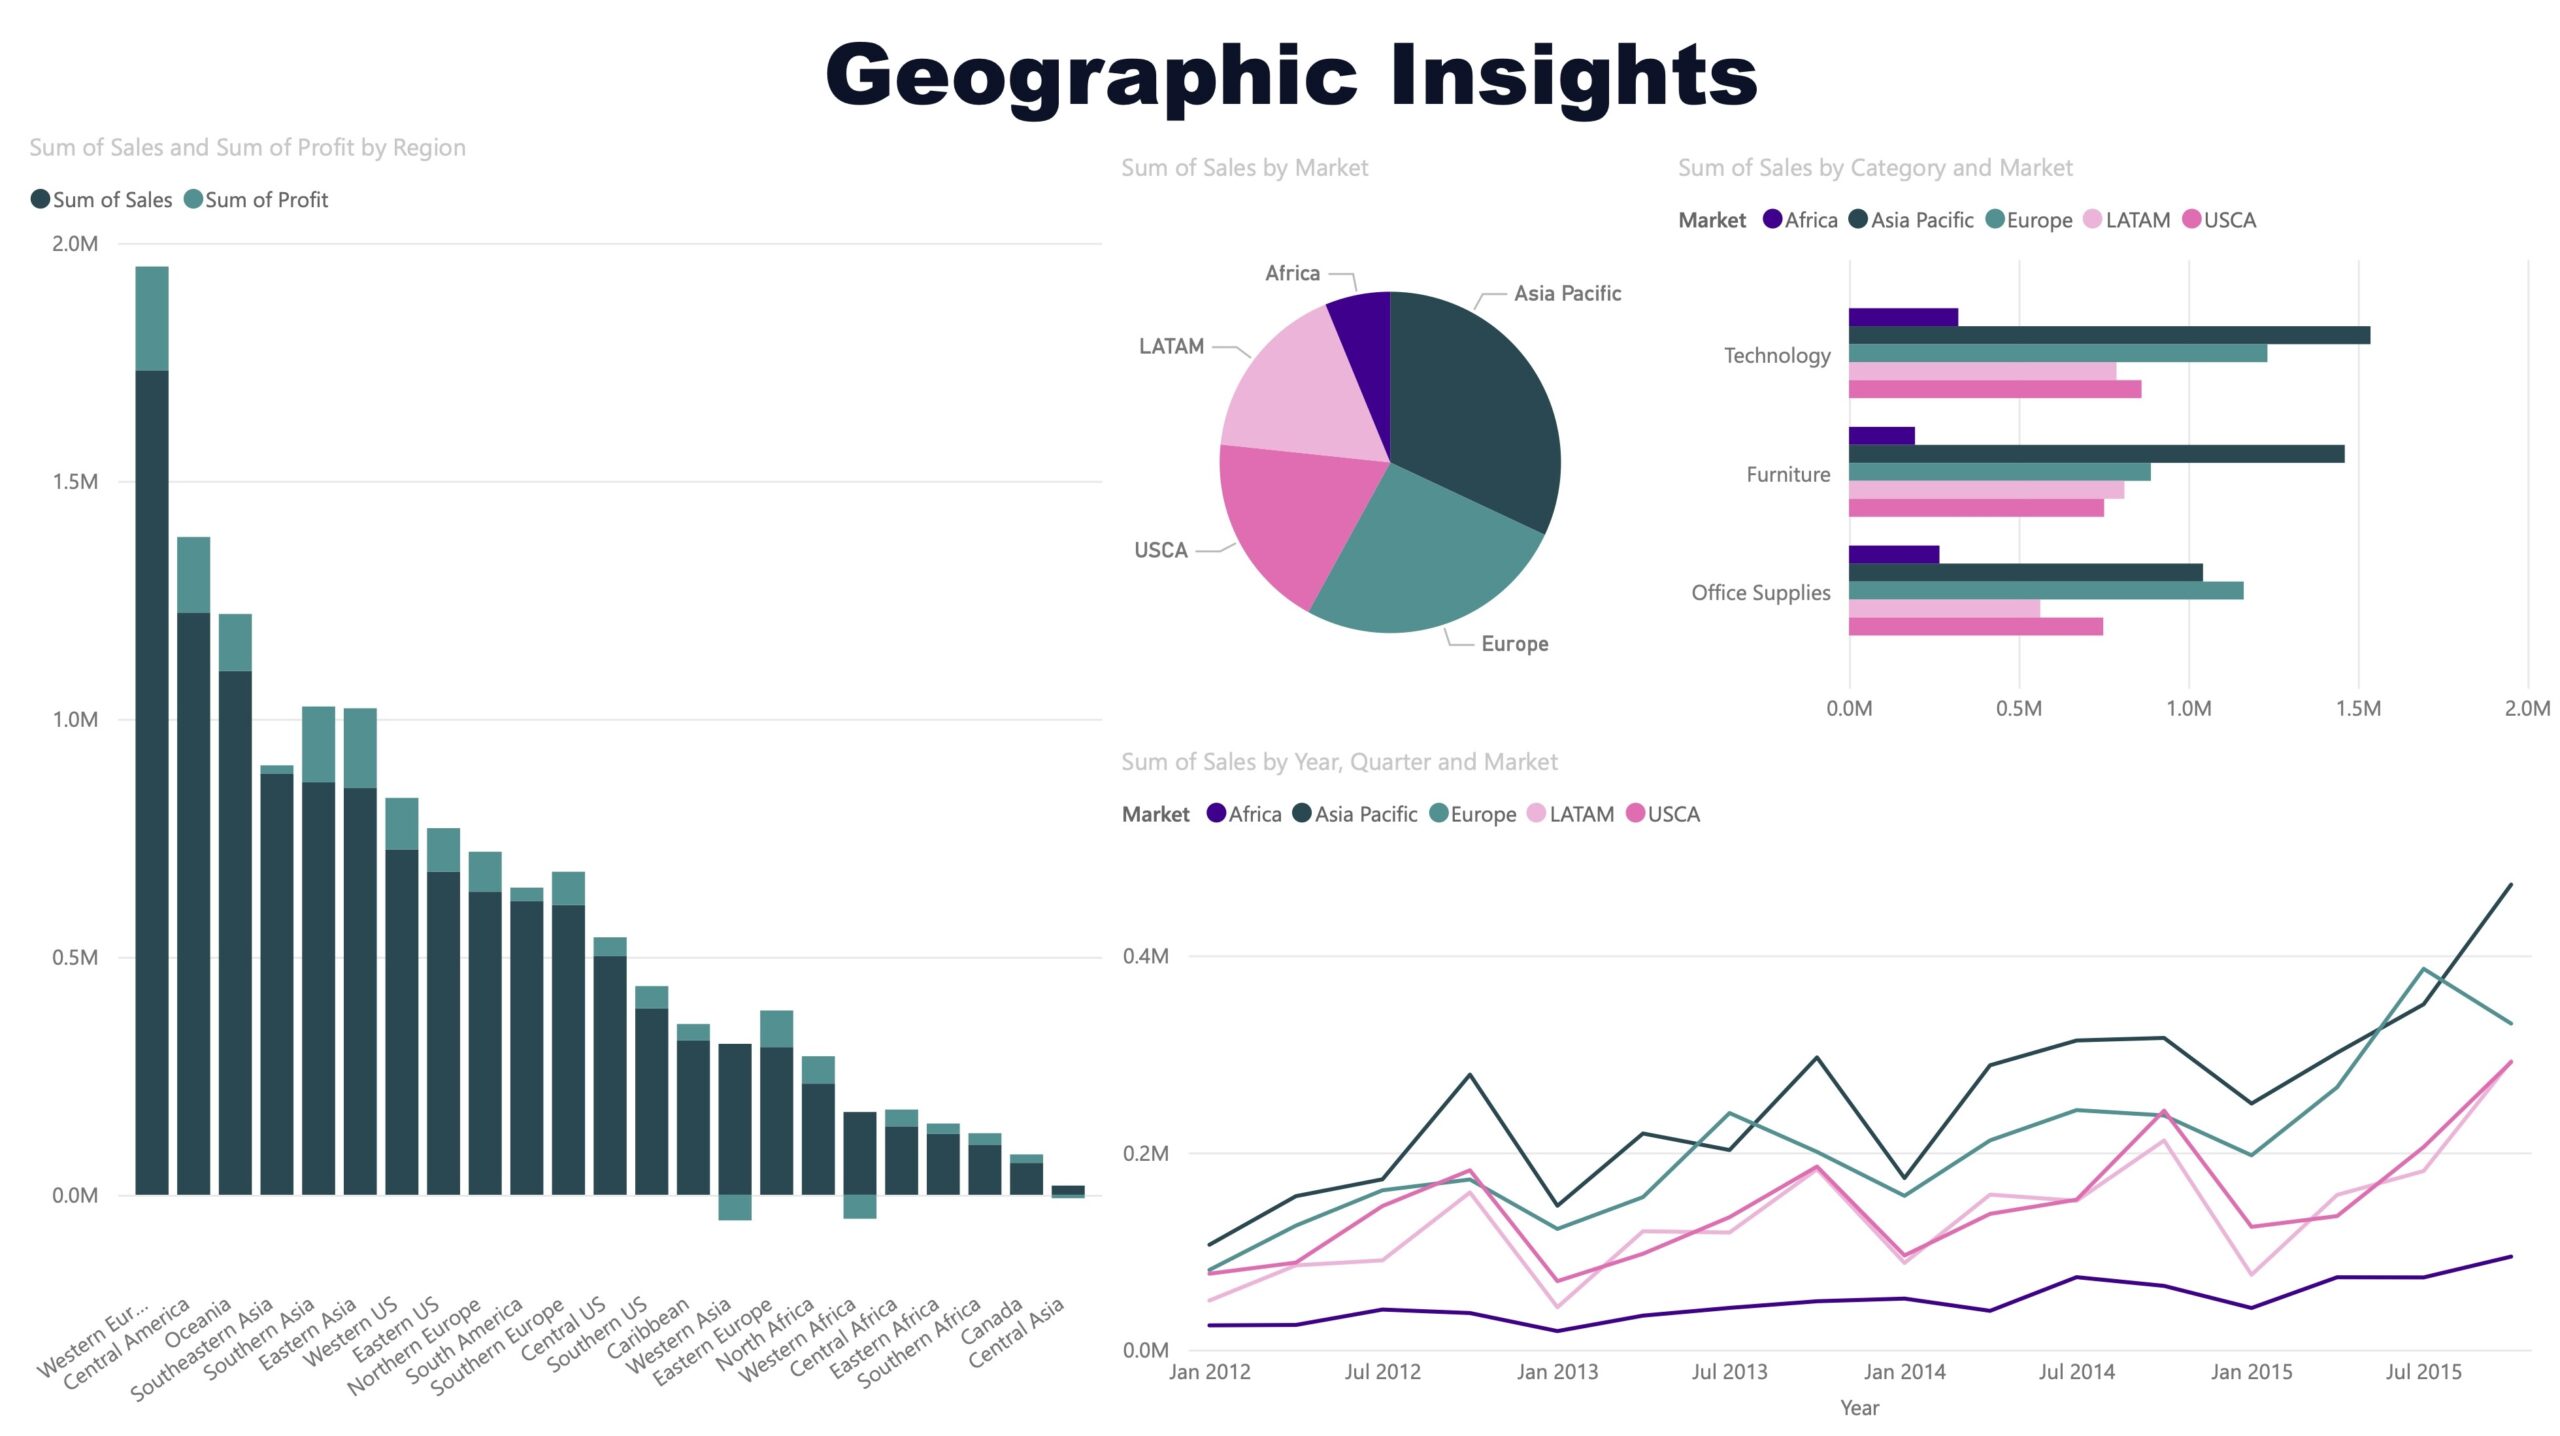
This dashboard shows the geographic distribution of sales and profits across regions and markets, with category-level breakdowns.
Insights:
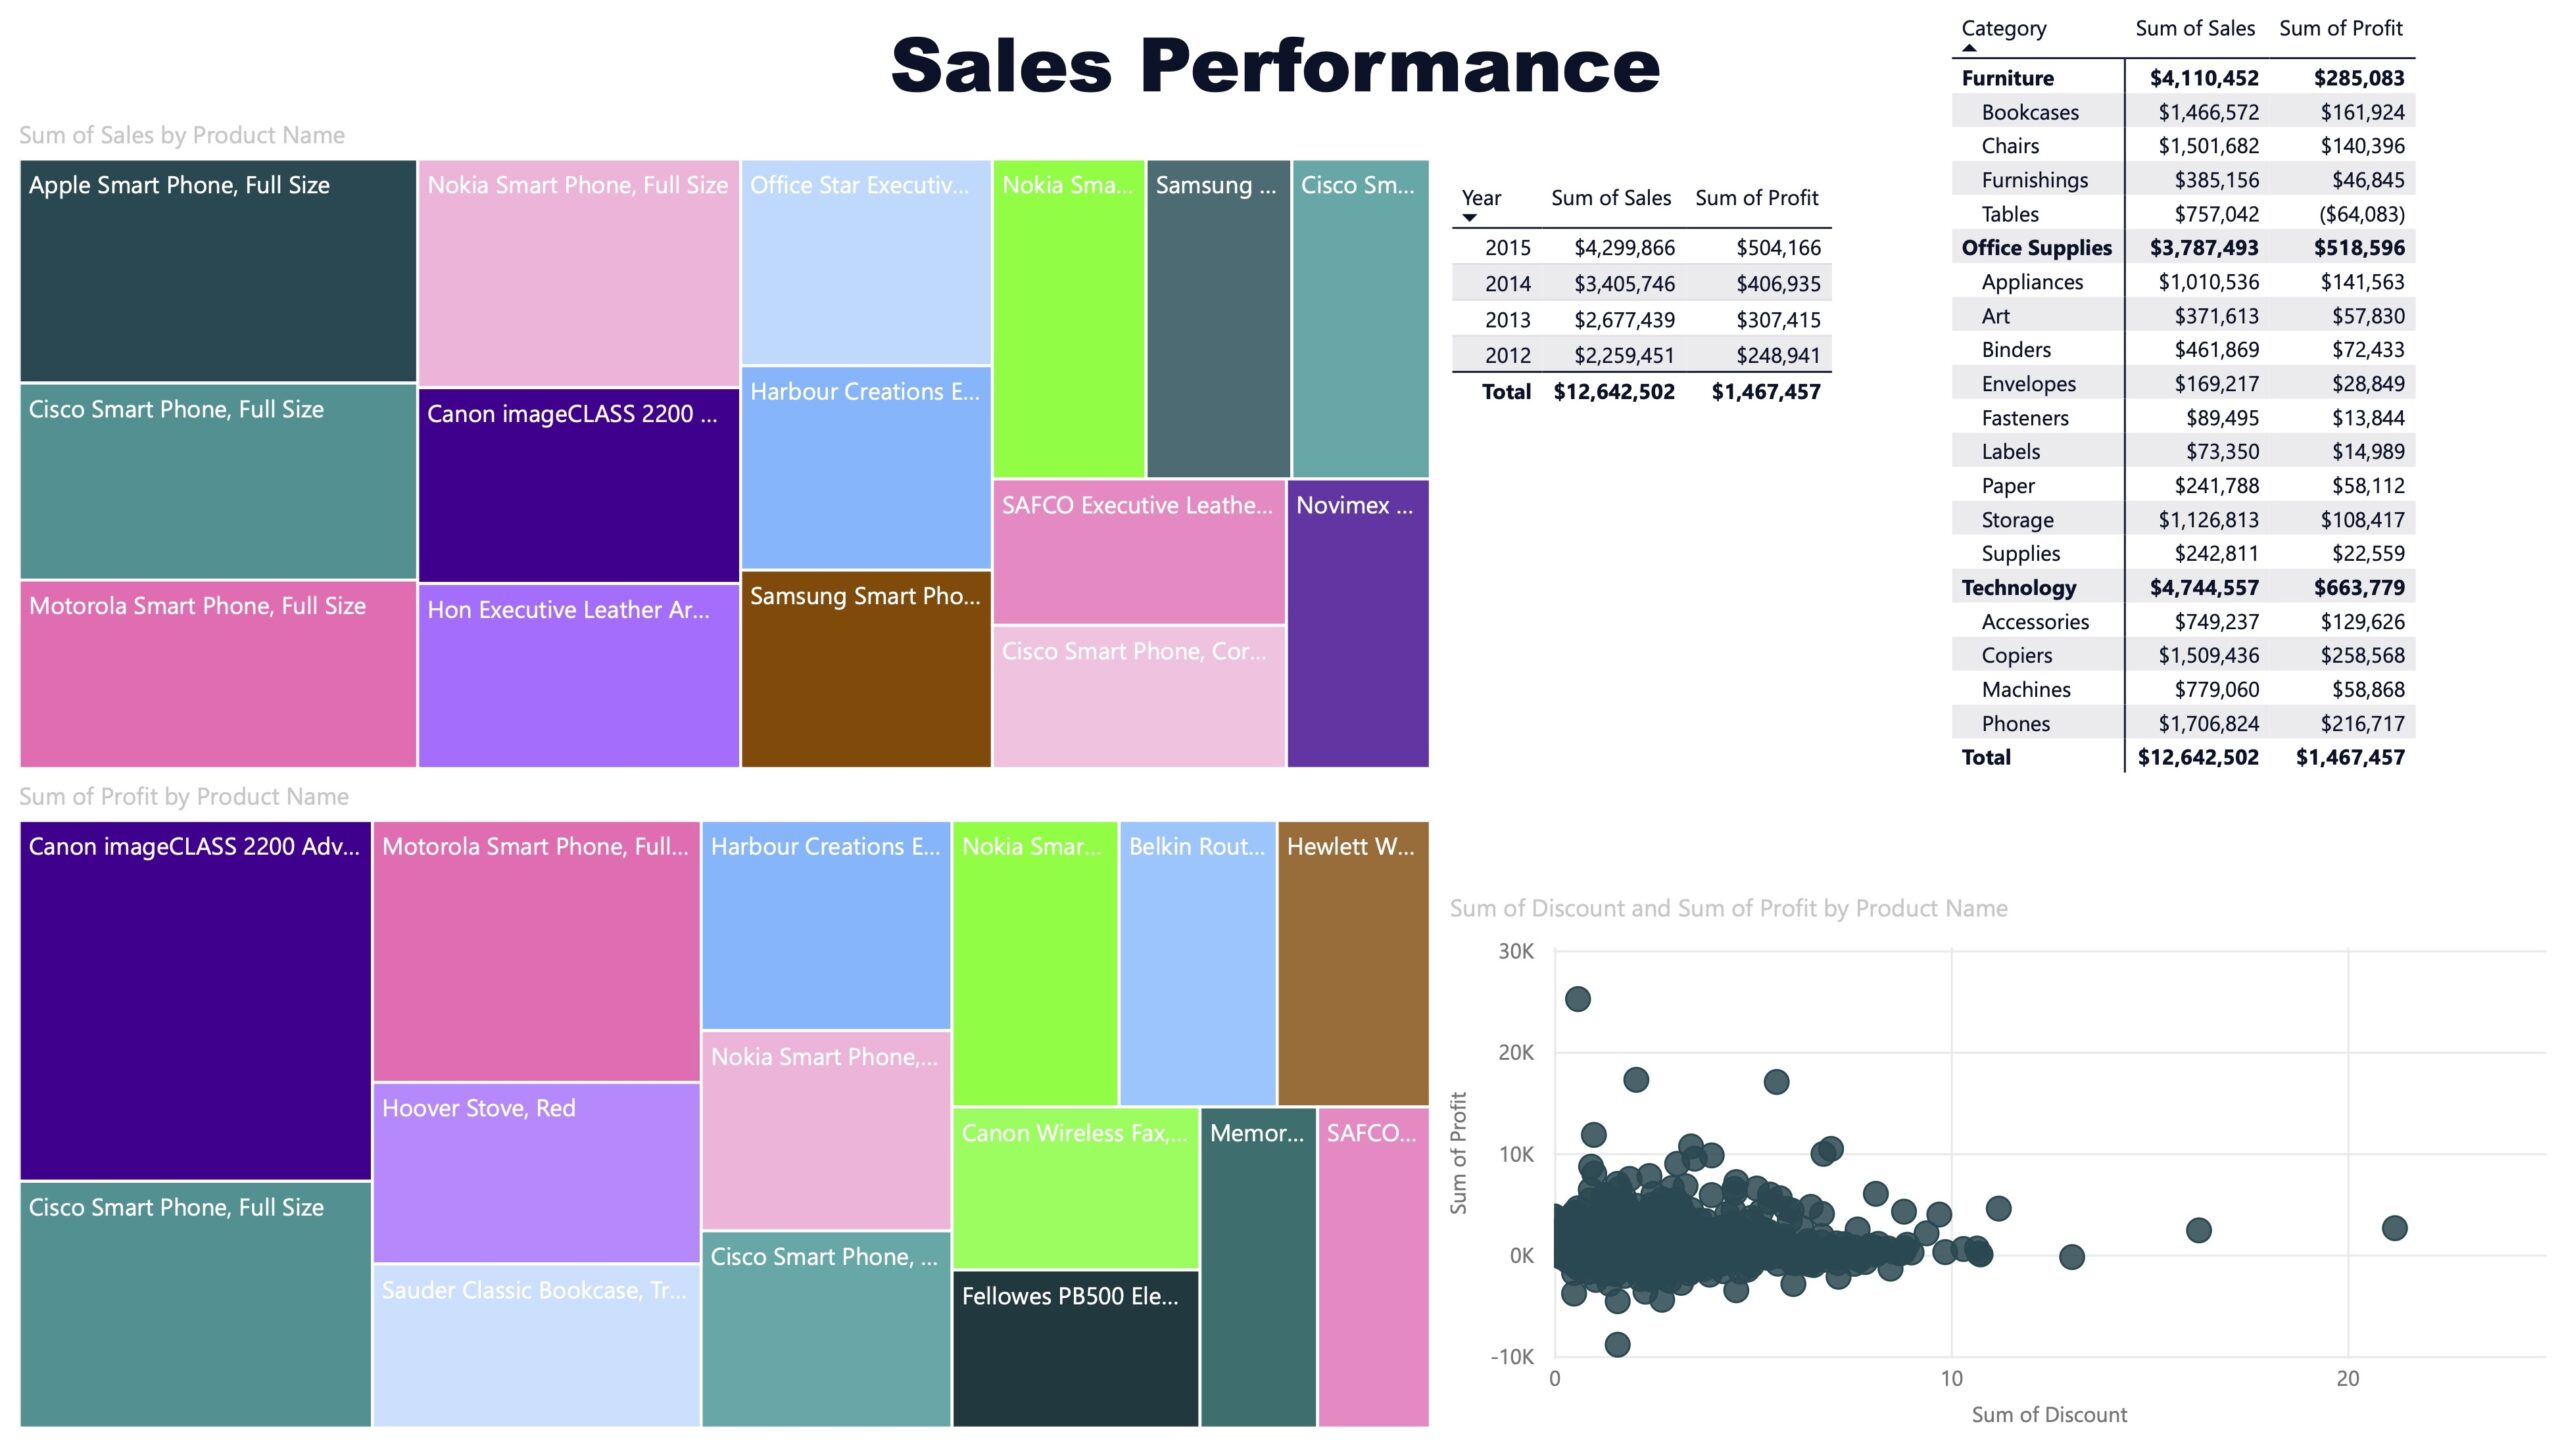
This dashboard analyzes sales and profit performance across years, categories and individual products, highlighting performance drivers and pricing impact.
Insights:
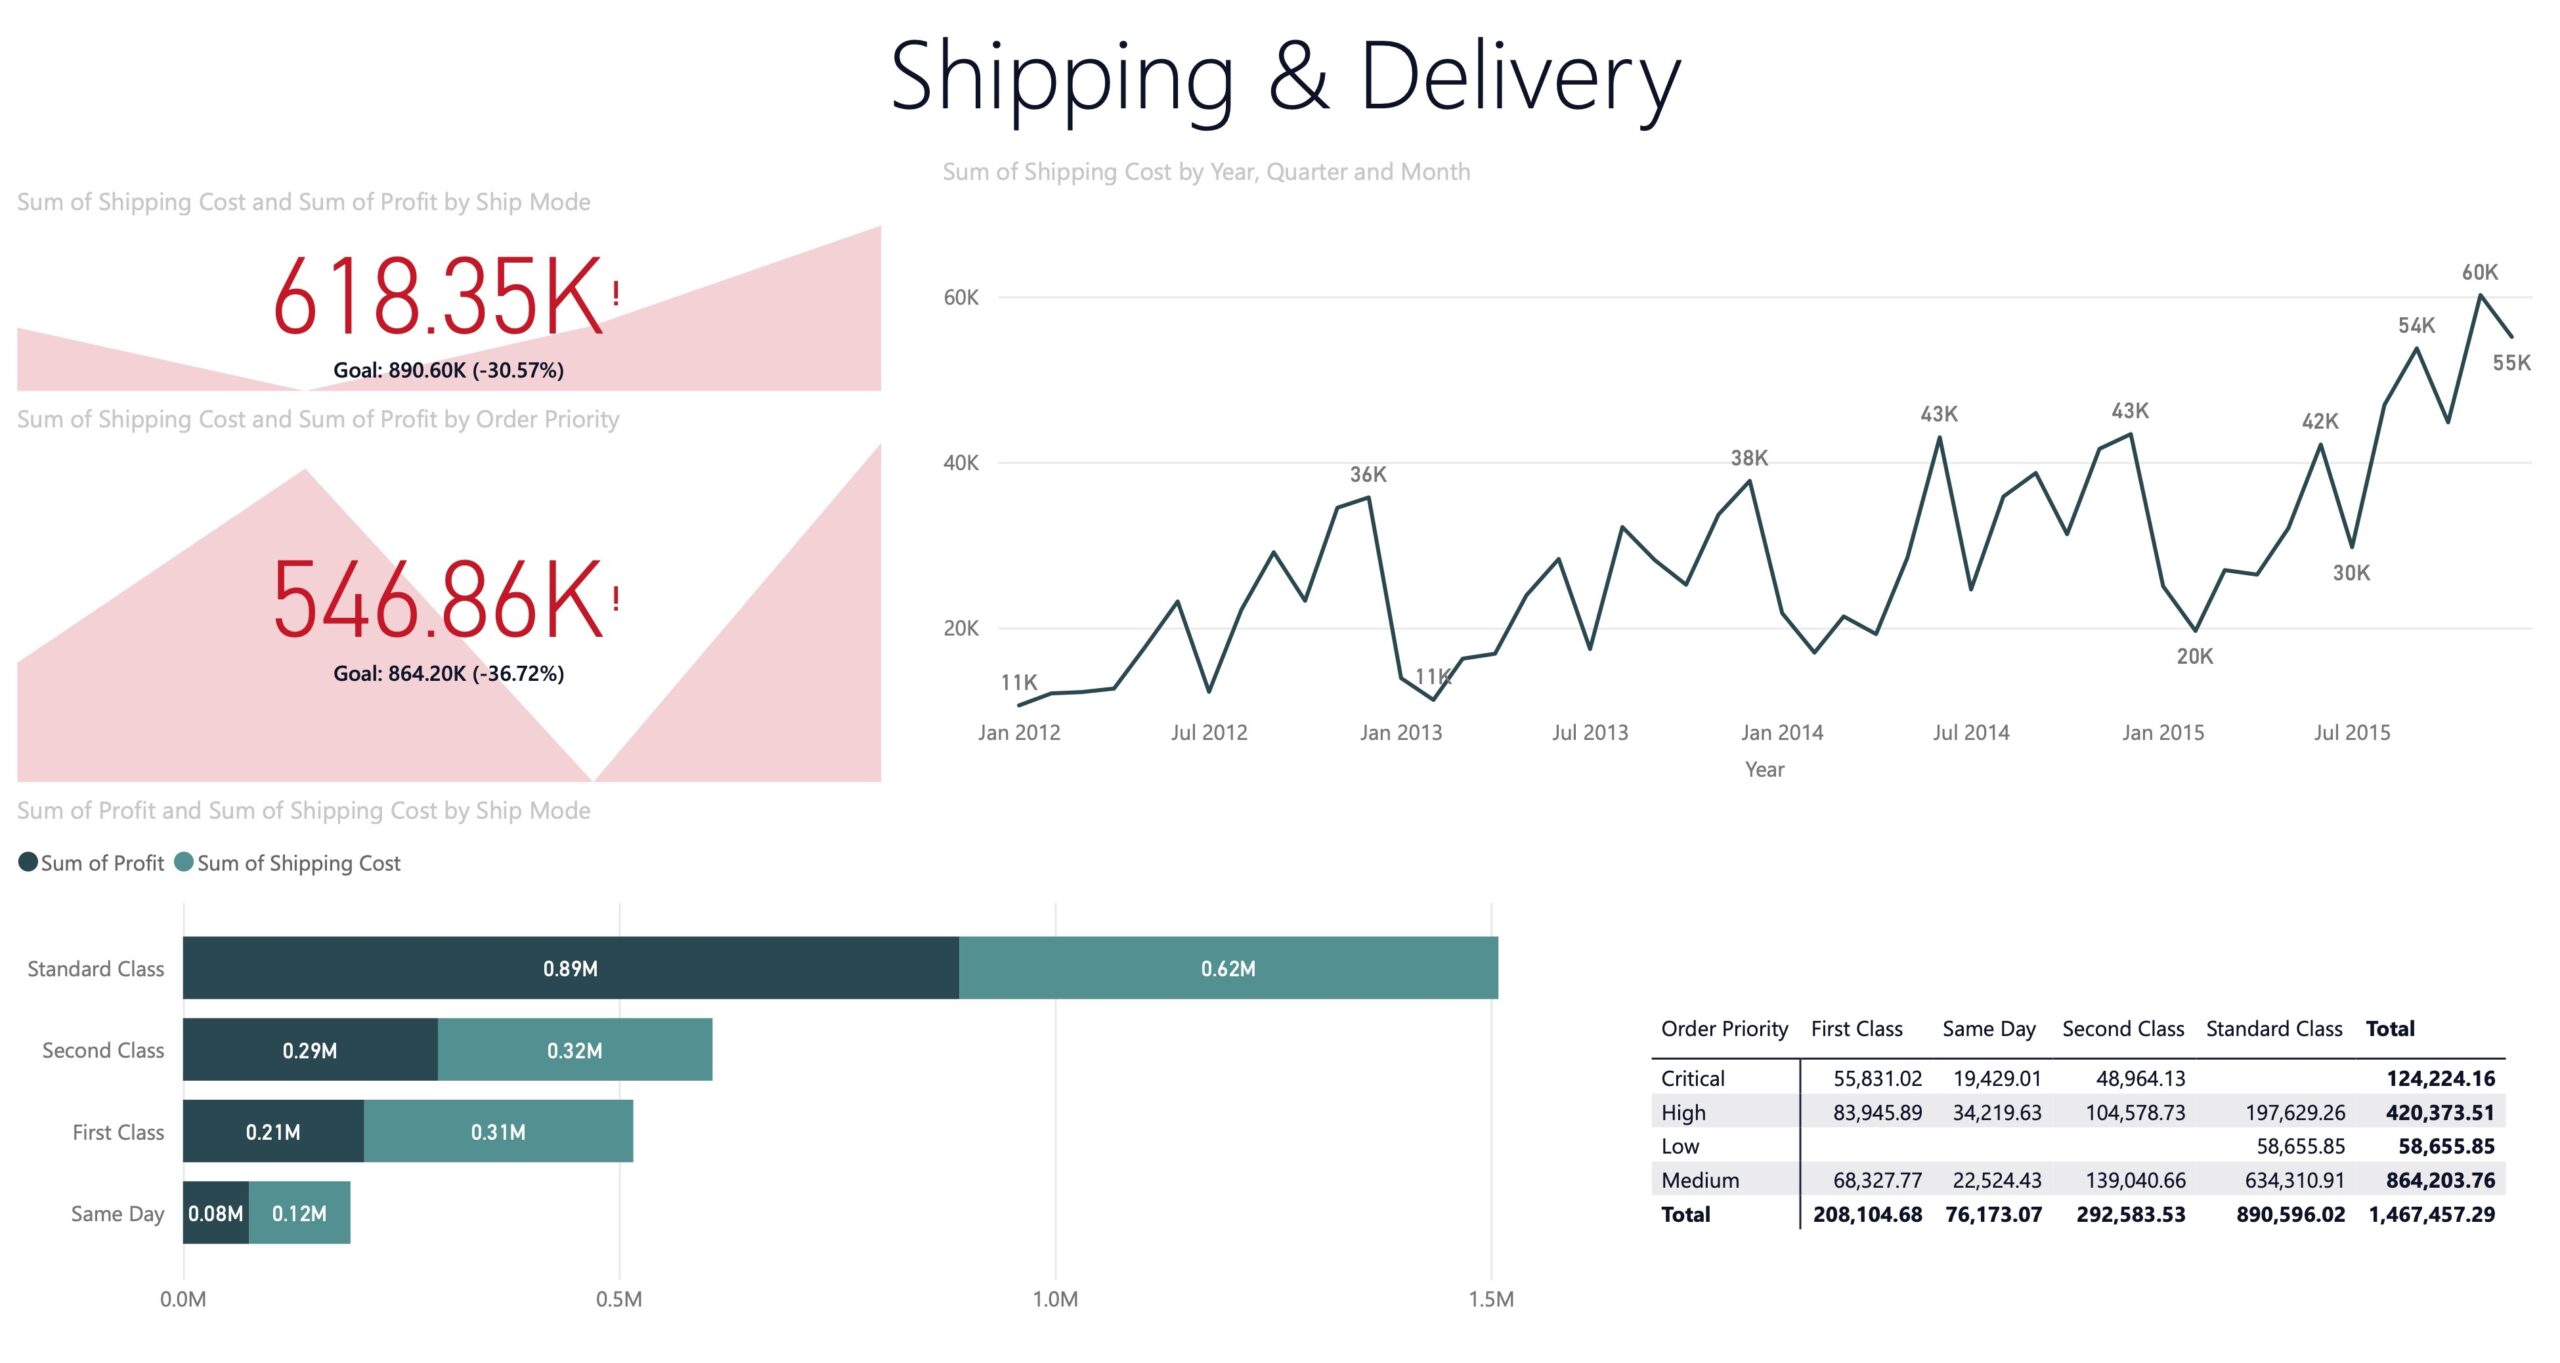
This dashboard explores the impact of shipping cost on profit margins, broken down by shipping mode and order priority.
Insights:
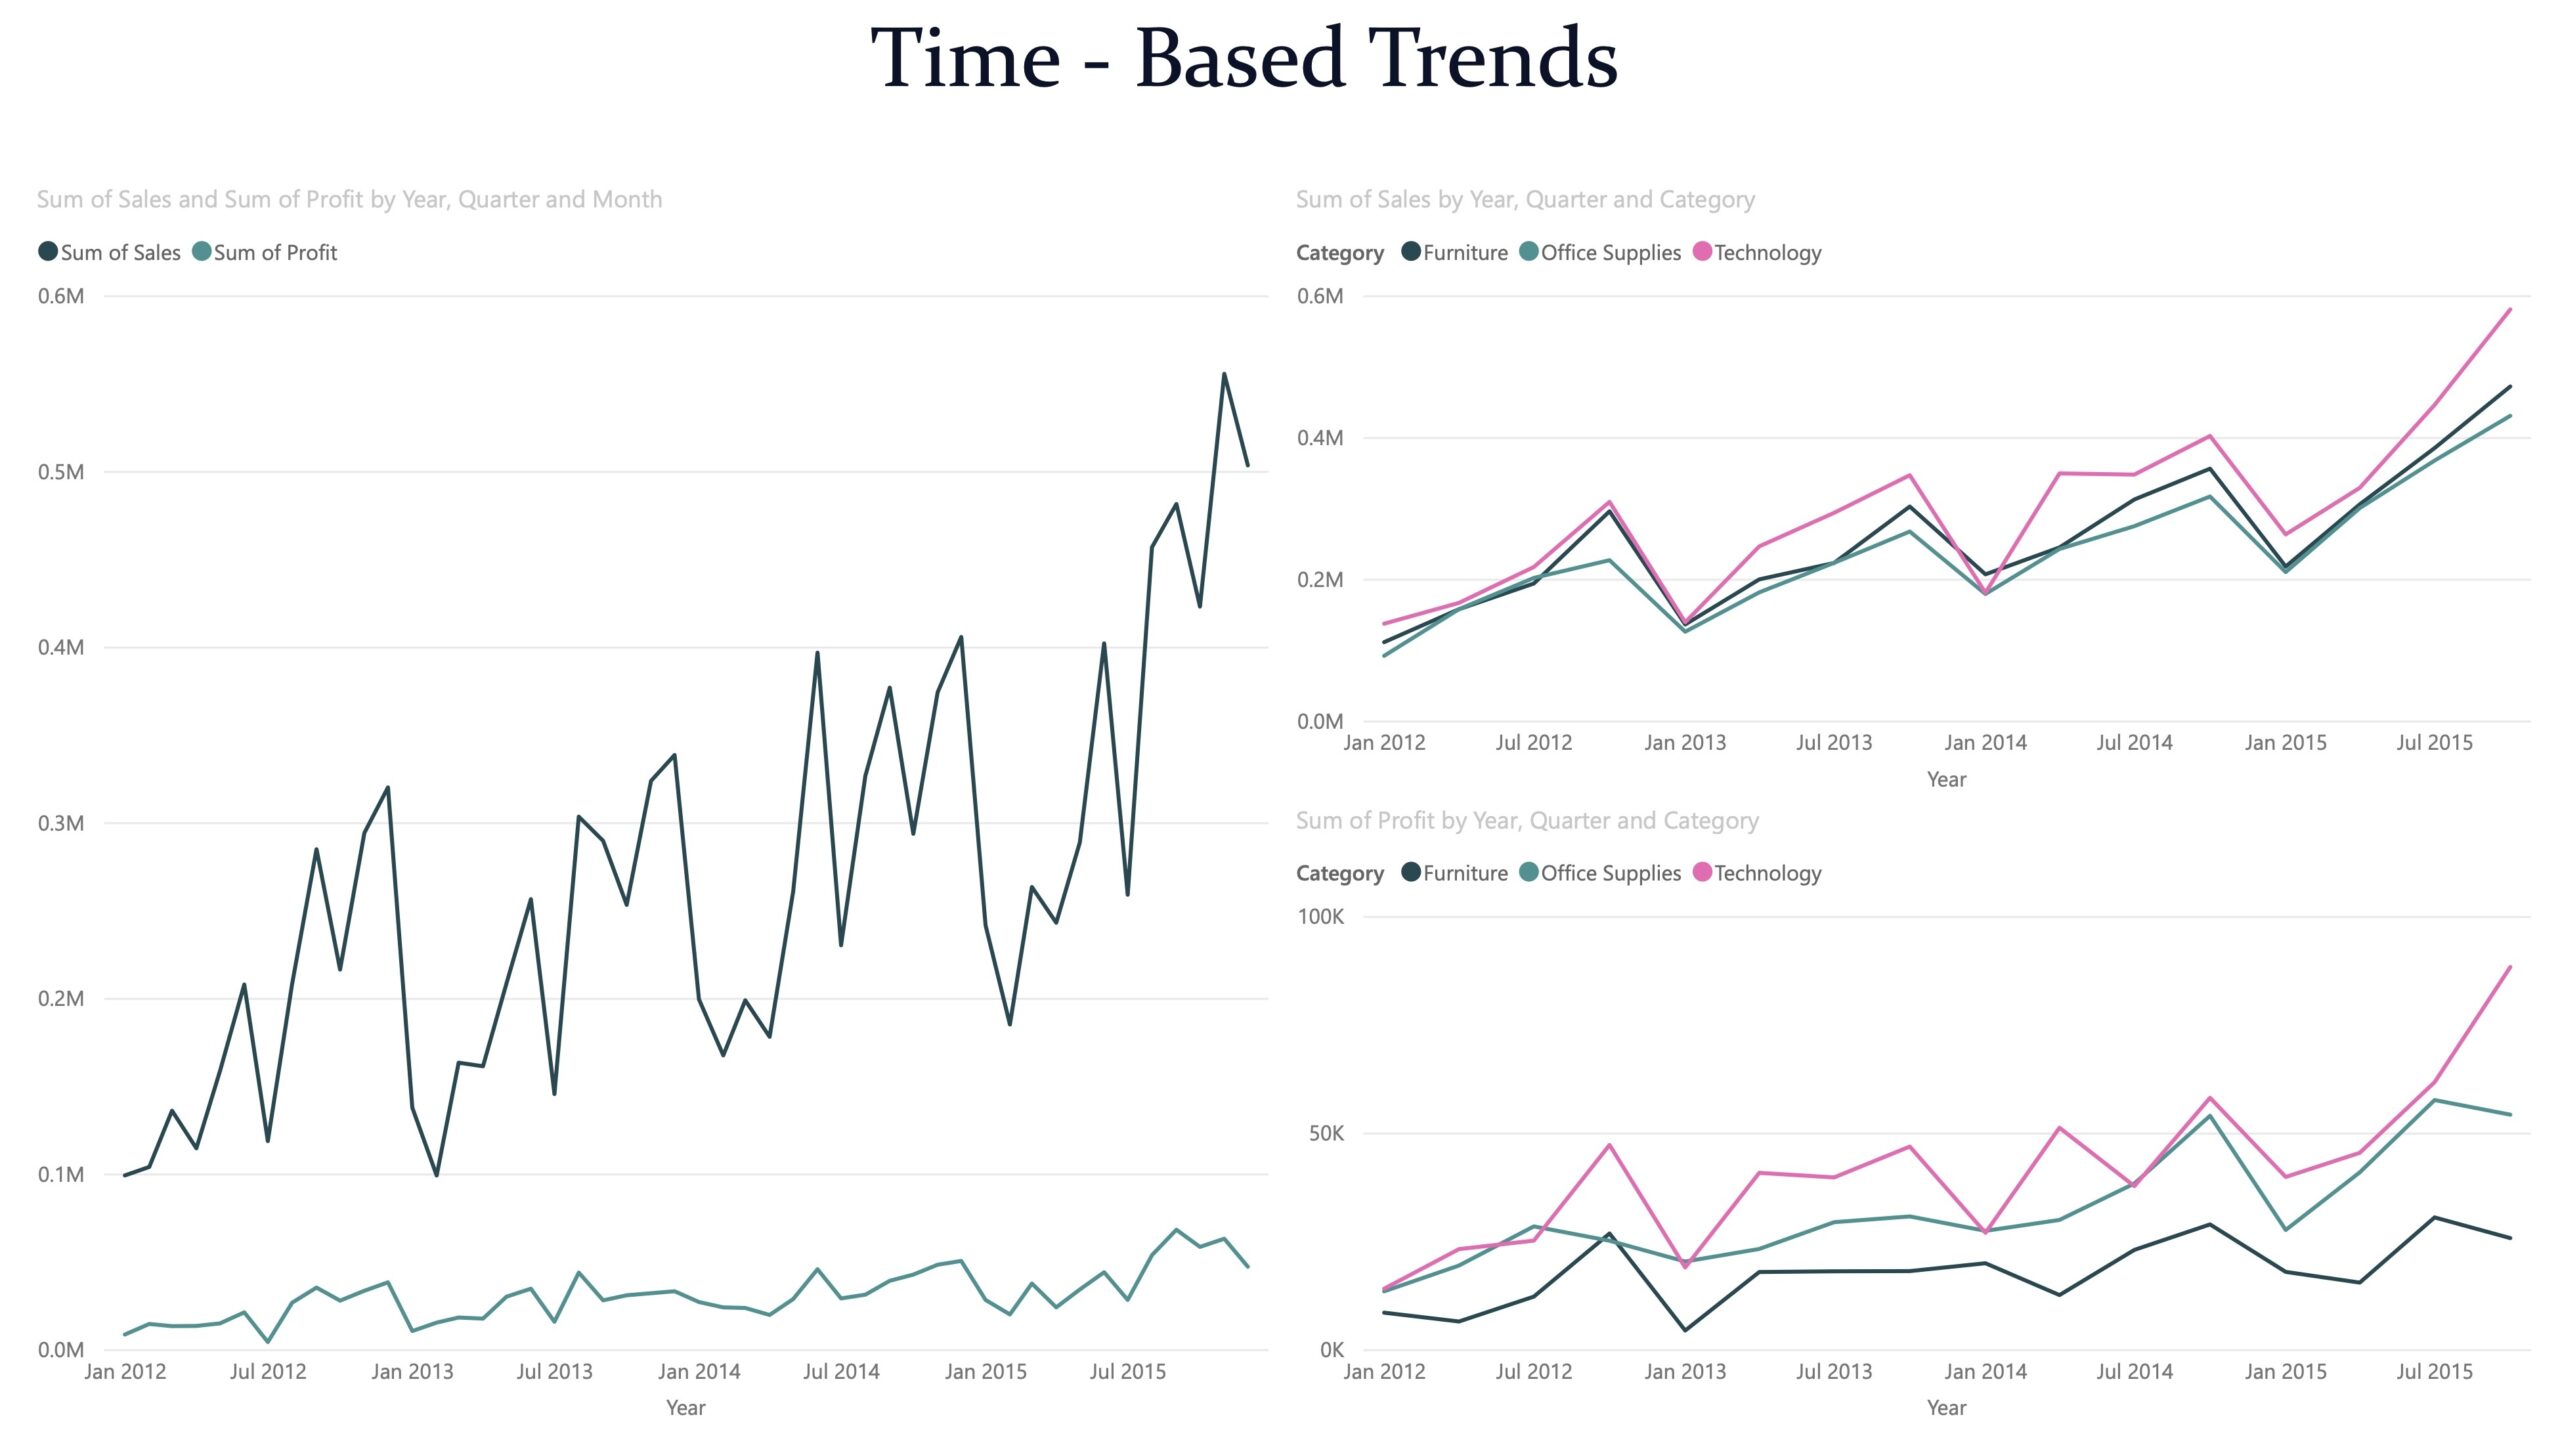
This dashboard visualizes how sales and profit evolved over time, both overall and by product category.